01 · LIVE
Real-time monitoring
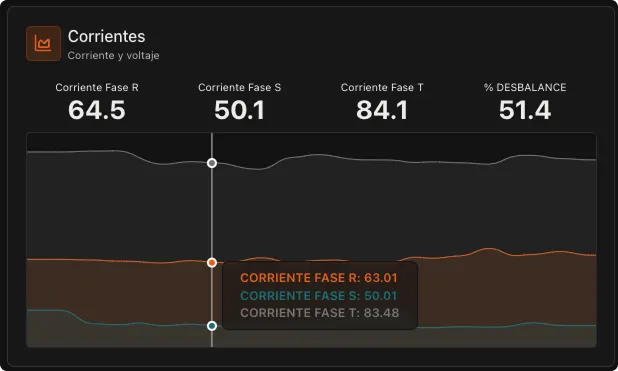
View electrical, mechanical, and process variables with sub-second latency from any device.

An agent that watches, understands and acts on your operation, 24/7.






THE SHIFT IS ALREADY UNDERWAY
LogOS assigns an industrial agent to your infrastructure—watching every signal 24/7, learning from operations and contacting you when something needs attention.
THE GAP
Industry has data. What it lacks is a layer that turns it into continuous, understandable and actionable operational context.
OUR MISSION
Enable every infrastructure to understand and improve itself through agents that continuously analyze, report and anticipate—without replacing existing assets.
We monitor your infrastructure while you focus on what matters.
70%
of industrial assets predate the cloud era
7 days
average deployment to begin operating
<1 s
end-to-end latency
+HOW LOGOS GOES LIVE
We map equipment, variables and protocols to integrate existing assets without replacement or plant downtime.
We normalize telemetry, configure history and alarms, and bring the local system online in 7 days on average.
Dashboards, digital twins and 24/7 agents turn every new signal into context to anticipate and act better.
FROM SIGNAL TO ACTION
One layer connects the field, builds context and turns every signal into a useful decision.
Modbus, OPC UA, MQTT, IEC 61850 and 40+ supported PLC families.
No rip-and-replace. No operational downtime.
Knows every panel, motor and air handler, upstream and downstream. Computes what is not measured, like a cell's internal resistance.
What used to be isolated data becomes visible and comparable.
Local AI, sub-second latency and operation even without internet.
Data sovereignty and critical responses where they matter.
24/7 agents that deliver the cause, alert the right person and draft the work order.
Operations stop reacting and start anticipating.
DIGITAL TWIN
Scan the real device, open its virtual shell and read edge telemetry in real time.
76%
395kW
69°C
401V
401V
404V
577A
559A
572A
133kW
129kW
133kW
LOGOS PLATFORM
LogOS analyzes your infrastructure 24/7, detects deviations, reviews quality and contacts you when a decision needs attention. Your team stops watching screens: fewer supervision hours, faster decisions and avoidable consumption detected in time.
TALK TO YOUR OPERATION
Answers with charts and tables from your real data, and shows what it checked to get there.
“Did this happen before this month?”
Generates the PDF report instantly and sends it to the right person.
“Send it as a PDF to the shift lead.”
Creates monitors in plain language and alerts you with a diagnosis when the condition is met.
“Tell me if AHU-3 stays above 24 °C for 4 hours.”
Weekly and monthly reports, or a daily check that only writes when something changed.
“Check every morning and only tell me if something changed.”
On WhatsApp too: it writes to you, you ask, and it answers with voice notes.
01 · LIVE
View electrical, mechanical, and process variables with sub-second latency from any device.
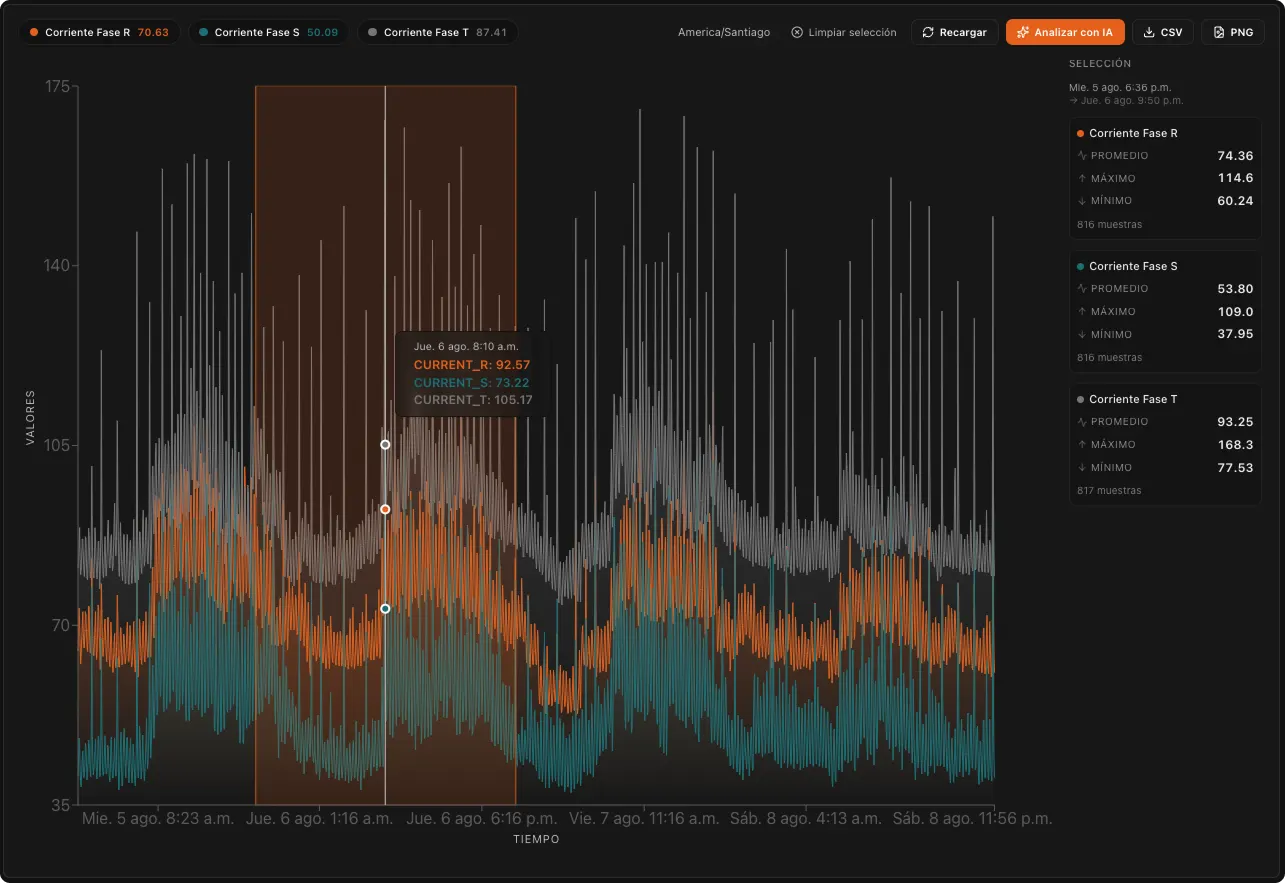
02 · HISTORY
Explore high-resolution history, compare variables and select operational windows to analyze with AI or export without losing context.
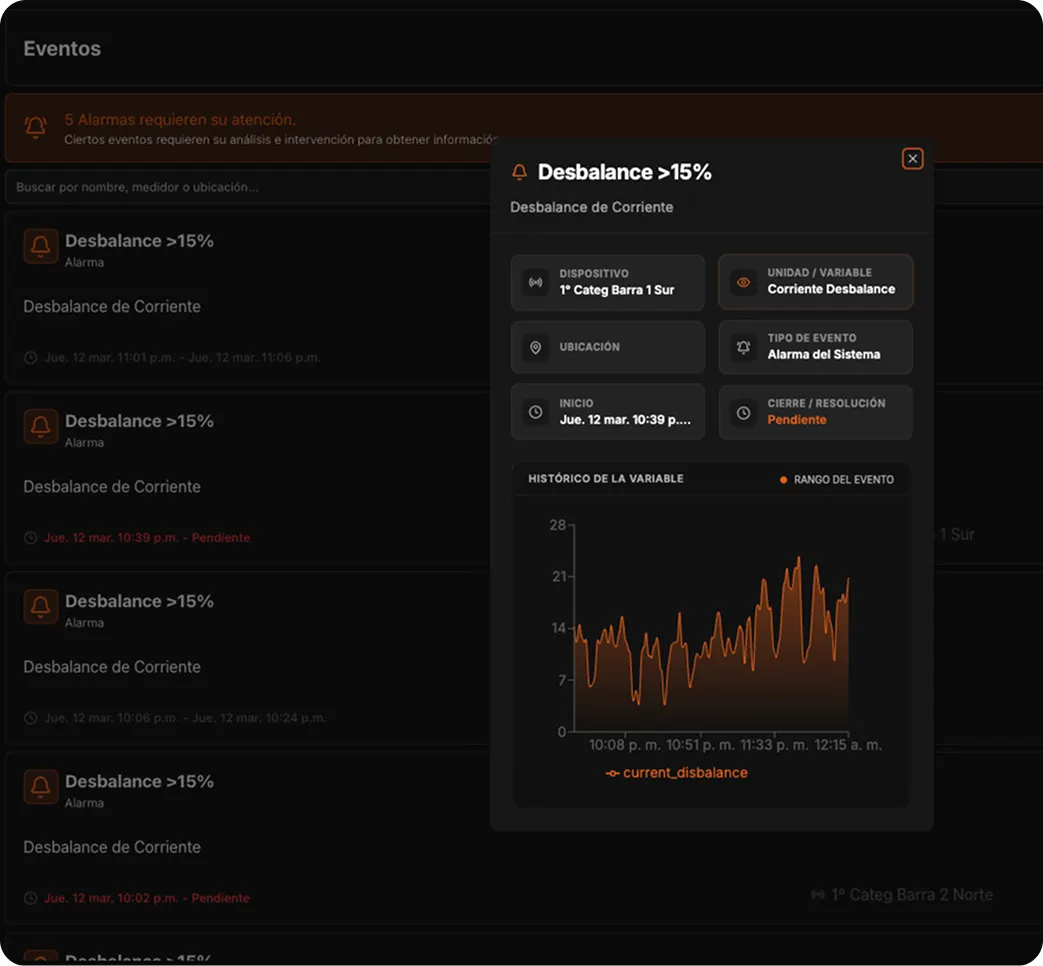
03 · EVENTS
Rules, events, and AI-driven predictions that anticipate failures and route notifications to the right person.
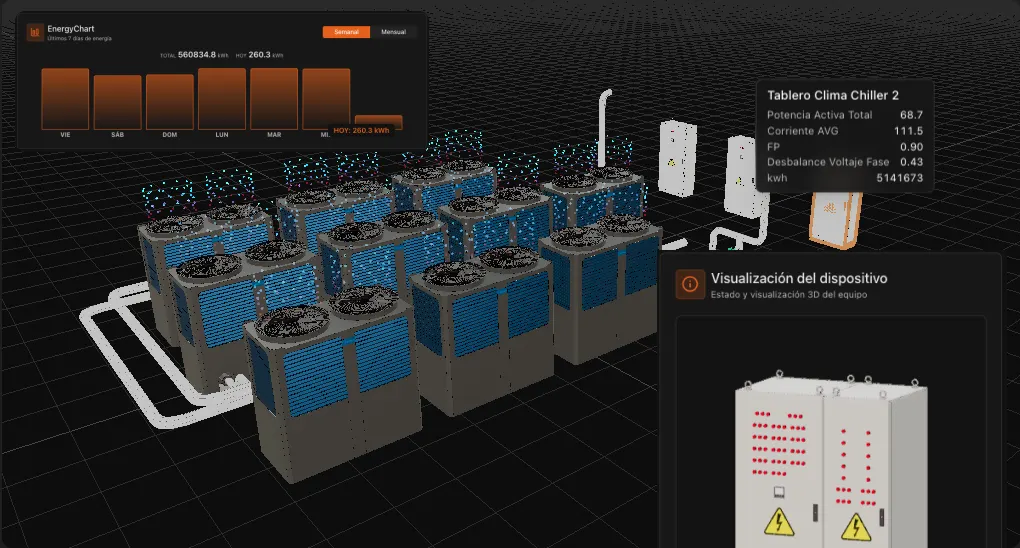
04 · CONTEXT
3D replica of your facility with the live state of every asset and each alarm placed on the equipment.
VALIDATED IN PRODUCTION
LogOS gave us visibility, analysis and prediction over our assets. Today we respond faster and have greater control over emergencies.
BEFORE / AFTER
What changes the day LogOS goes live.
TRADITIONAL STACK
Isolated SCADA
Data trapped in the control room.
Manual Excel reports
Wasted labor hours that add no value.
Radio or phone alerts
Response time measured in hours.
Reactive maintenance
Failures discovered after the line is down.
No historical traceability
Audits that depend on operator memory.
WITH LOGOS
Unified real-time data
One source of truth for field, IT and leadership.
Reports when you ask
Instant PDF from the chat and scheduled routines. No more manual Excel.
The agent writes and talks to you
WhatsApp with voice notes and the cause already analyzed. Response in minutes.
See degradation weeks ahead
Trends against a baseline flag the failure before it stops the line.
Auditable 6+ month history
Trends, compliance and continuous learning.